
“If you can’t measure it, you can’t manage it.” There’s definitely something to this adage. For it points to the significance of measurable data in the digital era. Thanks to “big data” – the high availability of data of all kinds – today, managers can now measure the effects of their decisions better than ever before.
But simply having this information is no longer anywhere near enough to create a competitive advantage in today’s day and age. Rather, the trick is in using analytics to generate strategically valuable insight from the existing volumes of data. Our experience shows that a lot of uncertainty exists as to which key figures are relevant and how to calculate them. We provide clarity in the jungle of numbers.
Only those who know where they want to sail will set sail on the right course
The first step in determining strategically relevant KPIs (key performance indicators) is the setting of clear objectives. In today’s hyper-dynamic corporate context, those who don’t know exactly where they are headed will act with the navigational competence of a headless chicken. The definition and interpretation of even the smallest division-specific key figures must be made on the basis of the underlying corporate goals. This begins with the most existential of all questions: Who am I and why am I here? If you cannot answer this question with certainty, this is a reliable indicator that you should first dedicate some time to forging your identity before continuing with the search for further performance indicators.
For all those who have sufficiently defined their strategic management goals, the next step is about deriving brand, product and division-specific objectives from these goals. These, in turn, serve as the foundation for the communication goals when it comes to your target audience. The communication strategy gives way to the relevant digital goals, which are measured with the help of KPIs and metrics.
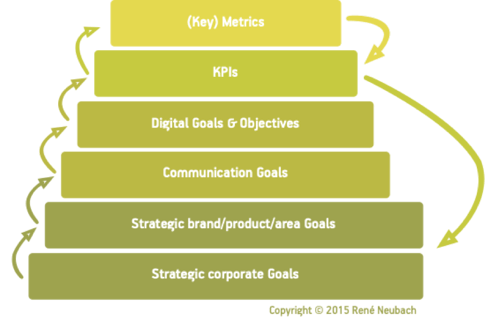
The major advantage of this method: The KPIs provide an indication of the level of attainment of the strategic goals, making them a reliable compass in the corporate management process. Here, the role of metrics is to measure the development of the KPIs. However, before we go into more detail on the difference between KPIs and metrics, it is important to make a distinction between objectives.
Good resolutions and SMART goals
Vaguely formulated, non-measurable goals all too often end up like New Year’s resolutions: By the end of the year, there’s little left to show of them. This is why it is important to break them down into specific, measurable, realistic and time-bound variables for the definition of meaningful KPIs. After all, sustainable managerial success can only flourish on the basis of SMART goals. SMART is an acronym for “specific, measurable, actionable, relevant, timely”. A goal is only SMART when it fulfils all five conditions and is thus measurable and verifiable. But don’t get us wrong: This in no way diminishes the worth of a good resolution – which is certainly of great value – but rather helps you to follow through with its fulfilment.
Every KPI is a metric, but not every metric is a KPI
The KPI provides information on how well you are sticking to your resolutions. It measures the effectiveness of the attainment of objectives at a strategic management level and tells you whether you are on course. It is the compass by which you set your sails. KPIs are precisely defined, quantifiable, and serve throughout the entire organisation process as a guideline by which to orient even the most seemingly trivial of decisions. This is why transparent, clear communication of the KPIs across all the functional and divisional areas of the company is of particular significance. Examples for KPIs are the customer base, the repurchase rate, the customer lifetime value or the net promoter score, to name just a few.
In contrast to this, metrics measure the status of a specific corporate process and are therefore often bound to a certain tactic, campaign or channel. The terminology covers a very broad range of meaning, and may refer to all variables that can be calculated. However, it is the nature of the metric to not provide any information with regard to how your business is developing. It is not a good advisor when it comes to defining the strategic course, but it does help you to readjust your compass – that is, your KPIs. The metric supports the validity of the KPI, and may become a KPI itself if it describes a variable that is crucial for the managerial success (e.g. online sales).
Same same but different
Depending on the type of underlying variable and relevance for the evaluation of the company’s performance, we differentiate between five types of metrics:
1. Vanity metrics
Key figures such as views, visits, unique visitors as well as the absolute number of friends, followers and likes fall into the category of the so-called vanity metrics. And those who run their business by these standards quickly fall into the disastrous trap of conceit. For although this data may be pretty to look at under certain circumstances, it has absolutely no substance at all. It provides no relevant insight for decision-making, and is often based on deceptive factors. For example, a peak in the new additions to your community may be caused by bots, i.e. automated processes.
2. Reach metrics
Reach metrics measure the range – that is, the number of people – that you reach with a particular means of advertising. What’s important here is the connection to a specific element, for example a Facebook post, since the reach is measured with variables such as views, visits and unique visitors, which – as discussed above – have a certain inherent potential for vanity. But by placing the metrics in relation to a specific communication element and its context, you can gain valuable insights into the efficiency of your advertising material.
3. Engagement metrics
Of even greater relevance than the reach metrics are those that provide you with information regarding the nature of interaction of your audience with your content. Engagement metrics describe, for example, how often your content is shared and commented upon. The level of engagement in your community should always be considered against the backdrop of variables such as bounce rate, web pages viewed per visit and the duration of the visit on your landing pages, so as to enable you to draw the right conclusions from this data.
4. Quality metrics
The key figures mentioned above – bounce rate, pages/visit and duration of the visit – fall into the category of quality metrics. They reveal how intensively your users engage with your content. In general, the following applies: If you are able to get your users to take 50% of the time that it would require to consume the respective content in its entirety, this can be considered a success. Further quality-related metrics are organic traffic and the traffic that directs visitors to your website from social platforms. These variables provide information concerning how well your content is optimised for search engines.
5. Conversion metrics
Every initiative should have the goal of achieving a conversion at some point in the customer journey. To give an example, this could mean a registration for an information service, such as a newsletter subscription. This is how you transform visitors into leads. Key figures such as the conversion ratio (leads/visitors), cost per acquisition (CPA) or cost per lead (CPL) make it possible for you to generate insights regarding the effectiveness and cost efficiency of your actions.
Whether a specific cost per lead is viable depends heavily on the average value generated by a newly acquired customer.
Nothing is absolute
Ultimately, when evaluating KPIs and metrics, what is so often true in life also holds true here: nothing is absolute, everything is relative. The absolute earnings figures differ significantly from industry to industry and from company to company. For example, whether a specific cost per lead is viable depends heavily on the average value generated by a newly acquired customer. In order to be able to accurately evaluate how desirable a performance-related key figure is, it is therefore necessary to draw upon internal key figure comparisons and to carry out external, branch-wide benchmarking. And: Perseverance pays off! Often, the most valuable findings stem from the analysis of the development of KPIs and metrics.
Ahoi
In a nutshell: We’re experiencing rough and choppy times in the sea of data of this digital era. Many are drowning in information even while they hunger for insight. Only those who understand how to navigate with the help of KPIs and how to support these with metrics will follow a secure, goal-oriented course.

Credit: © Anthony Indraus/Unsplash